But many real estate investors know that every asset is different and even two seemingly identical assets in the same area can produce very different returns. How can they better understand the true risk underlying their exposures when developing their strategies?
The answer may lie in looking at data beyond traditional sector and geographic analyses. By looking at the extreme outperformers and underperformers that drive the tails of total return distribution, we can more readily identify common sources of risk that pervade the entire portfolio.
First, we need to understand why two apparently identical assets in the same geographic area may produce very different investment returns. In short, differences in lease and tenant exposures, as well as the level of active management employed (e.g., refurbishment), can have a big impact on returns.
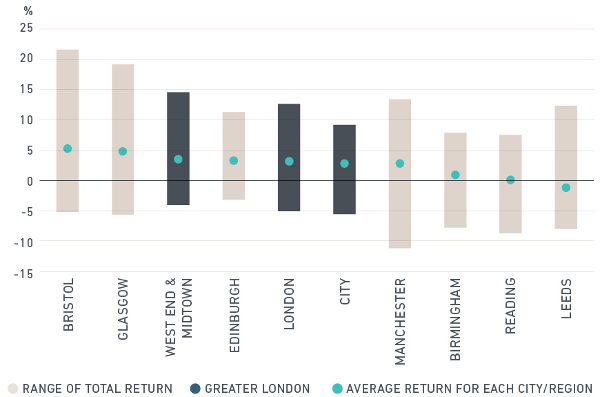
Before we focus on a narrow area, let’s examine how much specific risk existed in office assets across a number of U.K. cities during the 12-month period ended June 2017. Using analysis from Global Intel PLUS, we see that the range of returns within these cities was far broader than that of average returns across these cities (see exhibit below). Asset-specific risk clearly was very important in these markets.
Returns varied more within cities than across them

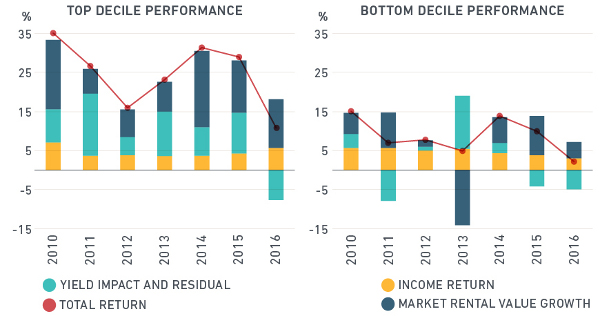
Looking at returns over a longer period showed asset correlations within these markets.1 The analysis below follows the performance of a consistently held set of offices in Central London over 2010 to 2016, comparing the top and bottom performance deciles. While there was a significant difference in the magnitude of returns between the outperformers and the underperformers, the profile of returns was very similar. This pattern illustrates that general market forces impacted all properties in the office segment similarly over time. Indeed, in 2016, even the best-performing assets were subject to negative yield impact following the summer’s Brexit referendum.
Top and bottom deciles showed similar long-term performance profiles, despite asset-specific risk .

While the total-return trends of the two tails were similar, the components of returns varied from year to year. Income return was marginally lower for the top performers, indicating the prime nature of these assets, but there was also more variability in the contribution of yield impact (a component of capital growth) and rental growth in the bottom decile.
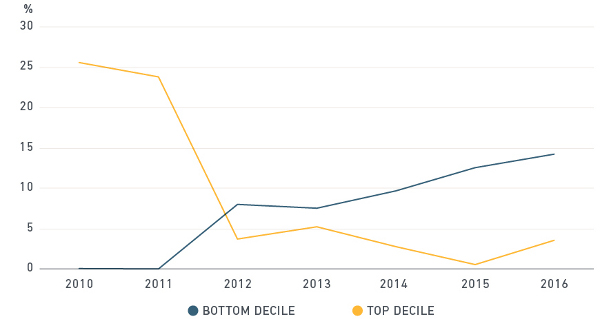
These metrics are generally driven by market-level dynamics. To understand more about the tails of the distribution, we need to examine asset-specific factors, such as vacancy rates. Returns in the top decile were buoyed by a fall in vacancy rates over the period to less than 5% from around 25%, while in the bottom decile they rose to 15% from zero. The best-performing assets initially had weak income profiles but were successfully leased up in an improving market. The worst performers were fully let initially but later suffered tenant loss, which ran counter to generally improving market fundamentals.
Vacancy rate trends varied sharply by performance decile

Our analysis suggests that variation in asset performance could not be fully explained by sector and geography. It may be important to consider other factors when formulating strategy and understanding risk. Traditionally, performance variation not explained by market selection was attributed to asset selection with the implication that this risk is idiosyncratic. Examining performance along alternative risk dimensions such as vacancy rates may help institutional investors better understand these underlying risk factors.
Source: MSCI


